Replica Data Library
Led product strategy that consolidated fragmented data access into a unified self-serve platform. This strategic initiative eliminated customer success bottlenecks, enabled data-driven product decisions through usage analytics, and became the foundation for scalable data product development, all while delivering users' most-anticipated feature.

The Challenge
Replica's valuable datasets were scattered across fragmented tools, creating significant barriers to user adoption and business growth. Data lived in silos across Places Study, Trends Dashboards, and a basic Data Downloads page with no universal access. Customer Success provided manual database access for advanced users, creating operational bottlenecks. Users couldn't discover available datasets independently, Customer Success was overwhelmed with repetitive requests, and the product team had no visibility into which datasets drove real value.
Role & Responsibilities
-
Led cross-functional product strategy for most-requested platform feature
-
Conducted user research and validation with government analysts and urban planners
-
Designed unified data architecture consolidating fragmented access into scalable platform
-
Collaborated with engineering on API design and technical implementation
-
Coordinated with customer success on transition strategy and impact measurement
-
Established analytics framework for data-driven product decisions and usage intelligence

Turn Data Access Into Competitive Advantage
The Data Library wasn't just a feature request, it was the foundation for scalable data product strategy.
Immediate Wins:
-
Eliminate customer success bottlenecks
-
Enable self-serve user workflows
-
Reduce barriers to platform adoption
Strategic Transformation:
-
Product Intelligence: Analytics on dataset usage to drive development priorities
-
Development Velocity: Days to launch new datasets vs. weeks/months of full integration
-
Platform Scalability: Foundation for data product expansion without operations burden

Solution: Unified Data Platform
One entry point for every dataset: search, filter, and download without switching between apps or teams.
Unified data discovery replaced fragmented access across multiple tools, enabling self-serve workflows that previously required customer success intervention.


Rich Dataset Information & Flexible Downloads
Download data in multiple formats, with clear schemas and metadata for quick analysis.
Rich metadata and multiple export formats eliminated the technical barriers that previously limited data access to only sophisticated users with direct database access.
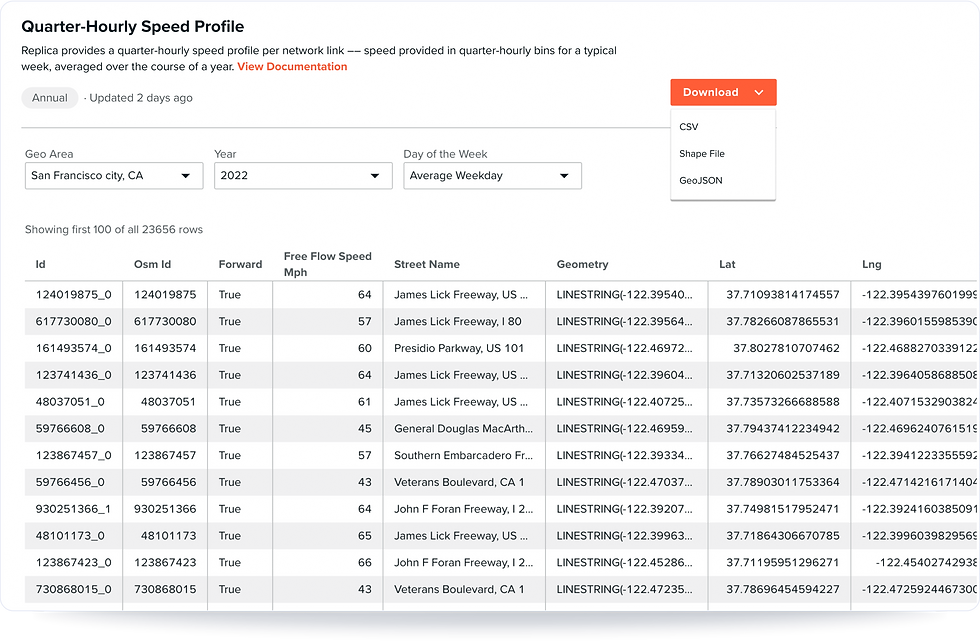
Advanced Filtering & Search
Find exactly the data you need with powerful search and filtering capabilities.
Sophisticated discovery tools enabled users to locate specific datasets quickly, eliminating the guesswork that previously required customer success assistance.

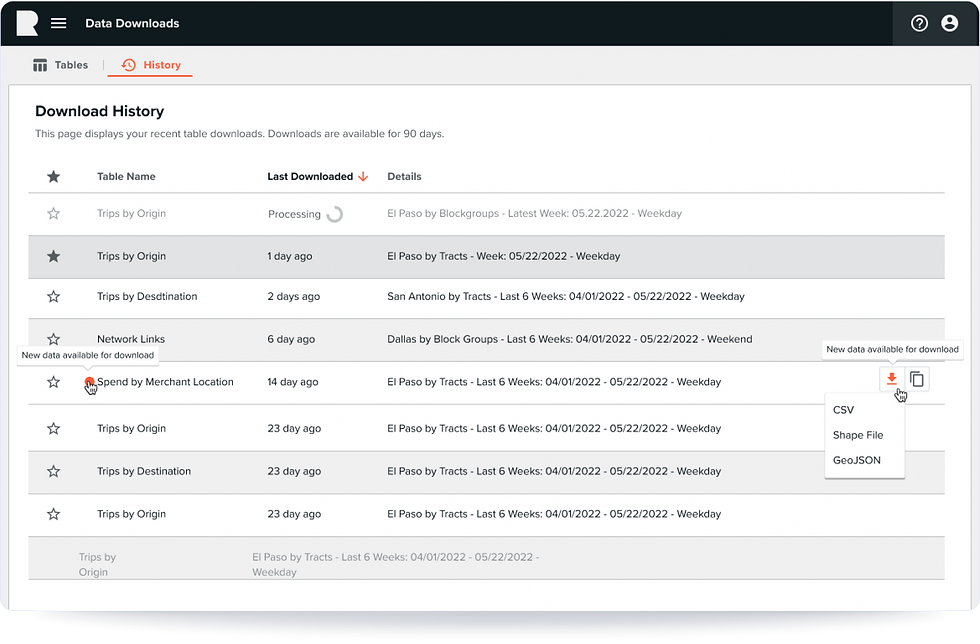
Persistent Query Management
Save queries once, return anytime to pull fresh downloads with consistent parameters.
Query persistence created repeatable workflows, transforming one-time data pulls into systematic analytical processes that users could build upon.
Platform Integration
Seamless integration with broader Replica platform for end-to-end analytical workflows.
The Data Library served as the foundation for platform-wide data access, enabling smooth transitions between data discovery, analysis, and visualization workflows.


Development Strategy & Process
User Research Foundation
Conducted extensive interviews with government analysts and urban planners to understand data access pain points and workflow requirements across different tools and use cases.
Cross-Functional Collaboration
-
Engineering: Designed scalable API architecture supporting rapid dataset additions
-
Customer Success: Coordinated transition strategy and measured support burden reduction
-
Product Analytics: Implemented usage tracking to inform future development priorities
Library-First Development Approach
Established new development paradigm where datasets launched in the library first, enabling:
-
Rapid validation: Test user demand before full application integration
-
Development efficiency: Days to production vs weeks/months for full feature integration
-
Data-driven decisions: Usage analytics informing which datasets warranted deeper integration

Why it matters
The data did not change. The experience did. Users can now move from question to answer without leaving the product. That reduces context switching, builds trust in the outputs, and shortens the path from exploration to decision.
Results Delivered
Strategic Foundation
Data-driven product strategy enabled through comprehensive usage analytics
Competitive differentiation via unified data access vs fragmented competitor solutions
Platform scalability established for data offerings without operations scaling
Business Operations
Dramatic reduction in customer data requests, freeing customer success for strategic work
Self-serve adoption eliminated dependency barriers for new users
Development velocity increased through low-effort dataset testing and validation
Product Performance
10x usage over any other Replica feature within months of launch
Most-requested feature delivered with highest user satisfaction in company history
Days vs weeks/months for new dataset delivery through library-first approach
More Work Examples

Tractics UI/UX Transformation

Replica Trends

Replica Places Studies

Replica Brand

mySidewalk Dashboards

Replica Studio